Turn a PDF report into editable PowerPoint slides with AI
Upload a three-page PDF, create a sourced four-slide PPTX, revise specific text and check native chart data. Includes the source PDF and actual generated files.
 Ofox
To turn a PDF report into an editable presentation with AI, ask for a new slide narrative grounded in the PDF, require page references, and inspect the downloaded PPTX. A preview or a .pptx extension alone does not prove that text and charts remain editable.
We uploaded a three-page, selectable-text PDF to Ofox Chat on November 4, 2026 and generated Japanese and Russian four-slide decks in Balanced mode. We then revised the Russian file and created an English adaptation. This Ofox-published tutorial uses synthetic data, not a customer report. The language versions share the same source and conversation; they are not independent accuracy benchmarks.
The downloaded Japanese and Russian originals contained text objects, a native chart and an embedded Excel workbook. The Japanese file opened in WPS Office on macOS, and its title could be selected as a text object. That supports editability for these files; it does not establish identical layout in every PowerPoint, Keynote or Google Slides version.
Download the source and outputs
Start with the synthetic three-page PDF. Compare it with the Japanese PPTX, revised Russian PPTX and English adaptation.
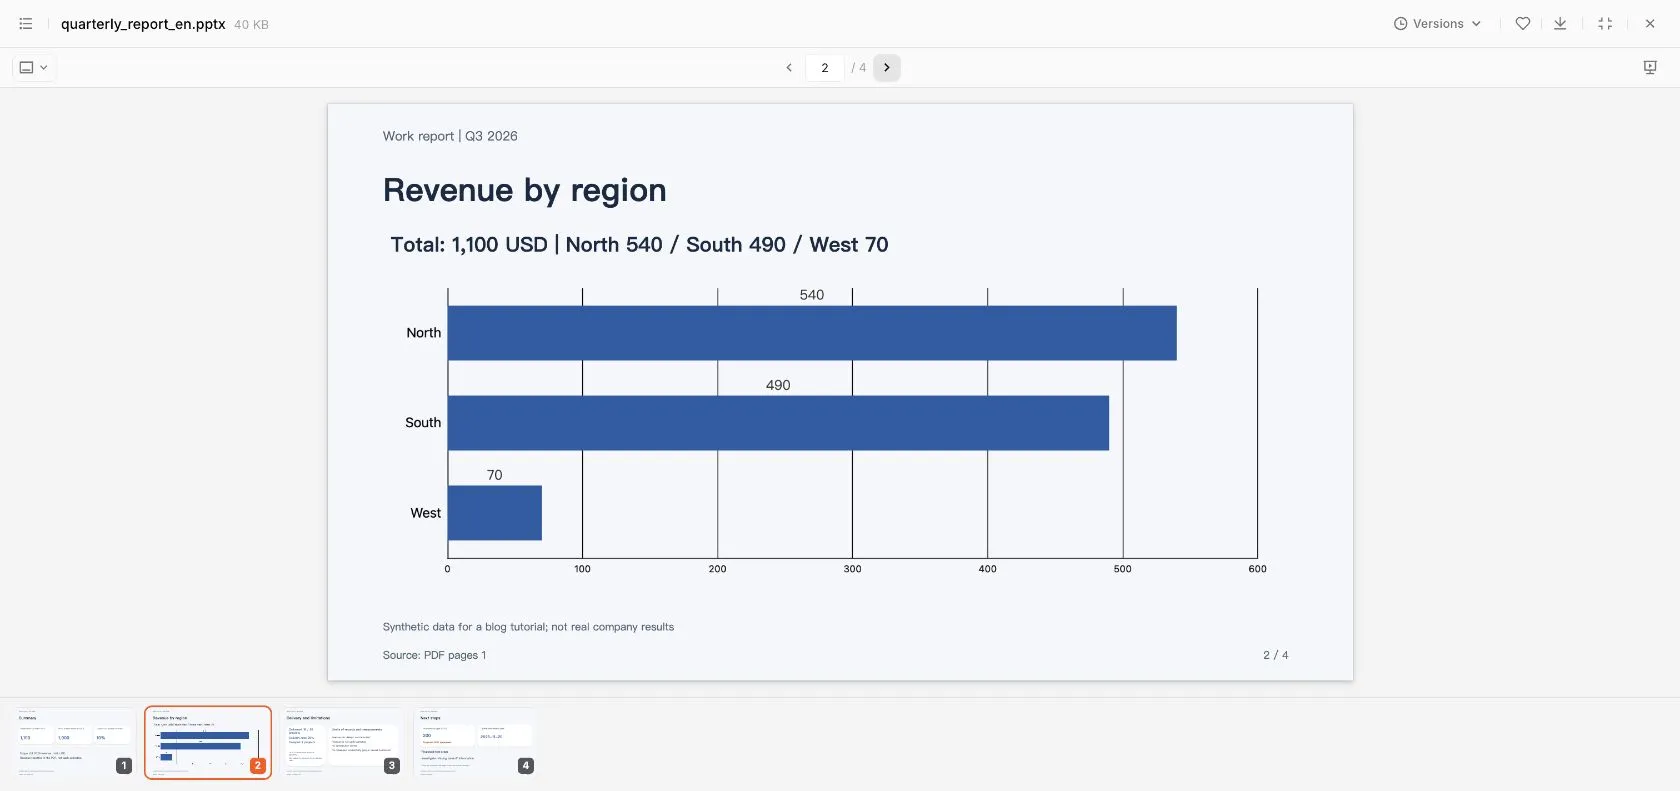
This is the actual English adaptation’s preview, not a generated product illustration. The cover is a conceptual illustration. The source file is intentionally small so readers can check every number and qualifier themselves.
Choose between conversion and a new presentation
There are two different tasks. Layout conversion attempts to preserve a PDF’s existing page arrangement. Presentation creation selects and reorganizes its evidence for an audience. This tutorial does the second: three report pages become four slides. It is not a pixel-perfect PDF converter.
If the PDF is already a slide deck and you need exact fonts and positioning, start from its original PPTX when available. If the PDF is a report, decide what the audience should understand or decide before generating slides. Adobe also documents a document-based presentation workflow; this is an alternative workflow, not evidence about Ofox’s results or a comparative quality test.
For several PDFs, first make a source-linked summary. Contradictory versions and unverified claims should be resolved or explicitly preserved before they become a polished presentation. If your source is a clean text brief, the work-presentation tutorial covers that simpler starting point.
Read the PDF before delegating the slide narrative
Check that the PDF opens and that text is selectable. Know its page count and whether tables are legible. The test did not cover scanned PDFs, handwriting, password-protected files, very large documents or complex multicolumn layouts. For a scan, run OCR and verify the extracted values before expecting the same workflow to work.
Upload only material you are authorized to process. For confidential reports, follow your organization’s approved-tool and data-handling policy. Use a redacted copy when identifiers or unrelated sections are unnecessary; do not upload secrets simply to reproduce this tutorial.
Create a compact evidence ledger before generation:
| Source page | Evidence | Constraint on the slides |
|---|---|---|
| 1 | North USD 540, South 490, West 70; total 1,100; prior quarter 1,000 | Preserve region labels and currency; growth is 10% |
| 2 | 18 of 20 scheduled projects delivered; two delayed | 90% is the delivered share; do not rename it an on-time rate |
| 2 | Delay reasons not recorded; revenue differs from cash collected; no satisfaction survey | Do not invent explanations, collections or customer satisfaction |
| 3 | Proposed USD 200 budget, not approved; review on 2026-11-20 | Keep proposal and approval status visible |
| 3 | Investigate missing handoff information; no measured productivity gain or causal finding | A next action is not an achieved result or established cause |
The independent arithmetic is 540 + 490 + 70 = 1,100, (1,100 − 1,000) / 1,000 = 10%, and 18 / 20 = 90%. Correct arithmetic does not establish the meaning of a metric: the source must justify its label as well.
Upload the PDF and specify the deliverable
In our English interface, we opened Chat and used Add → Upload from computer. After quarterly-brief-synthetic.pdf appeared as an attachment, we sent the request in the normal composer with Balanced selected. We did not need to paste the PDF’s contents into the prompt. Account access and sufficient balance were required; no fixed generation price is promised here.
The original request asked for Japanese and Russian versions together. This reusable English adaptation asks for one language so you can inspect one output before adding translations:
Read the attached PDF. It contains synthetic tutorial data.
Create a downloadable, editable four-slide PPTX in [output language]
for an internal quarterly review:
1. Summary
2. Regional revenue
3. Delivery and limitations
4. Proposed next actions
Preserve the PDF's exact values, units, dates and approval status.
Include the supporting PDF page number on every slide.
Do not invent causes or achieved outcomes that the PDF does not establish.
Use editable text boxes and, if supported, a native editable PowerPoint
chart for revenue. Do not flatten entire slides into images.
Return the actual PPTX plus a short fact/reconciliation table.
No web research, image generation or video is needed.
Ask the assistant to flag unreadable pages instead of filling gaps. For a longer report, request the outline and page mapping first, check them, then generate the deck. Our short three-page example fit a single generation request; that is not a recommendation to skip the outline review for complex work.
Verify claims before approving the design
Read the generated deck against the ledger, not just against the assistant’s summary. The output preserved the USD 200 budget as an unapproved proposal and explicitly avoided calling 90% an on-time delivery rate. Those qualifiers matter more than whether a slide looks polished.
On each slide, check the title, number, unit, period, denominator and source page together. Page references must lead to actual supporting statements. A footer saying “PDF p. 1” is not a verification mechanism by itself.
Our four-slide structure uses pages 1–2 for the summary, page 1 for regional revenue, pages 2–3 for delivery and limitations, and page 3 for next actions. It carries the source’s limitations into the deck instead of relegating them to an absent appendix. No claim about improved productivity or why the delays occurred was added.
Test a narrow revision and compare the files
The Russian original used English thousands separators (1,100, 1,000). We asked for spaces (1 100, 1 000) and changed only the fourth slide’s heading:
Revise only the Russian presentation. Change the thousands separators
from 1,100 and 1,000 to 1 100 and 1 000.
Change slide 4's title to “План действий”.
Keep the values, other content and editable chart unchanged.
Return quarterly_report_ru_v2.pptx; preserve the original file.
Do not research or generate images.
We downloaded the revision and compared the PPTX package. Only slide XML for slides 1, 2 and 4 changed; slide 3, the chart XML and the other package entries remained unchanged. That is consistent with the requested edits. A localized separator correction changes display text, not the numeric chart values.
For your own revision, name the slide and exact change, state what must remain fixed, and use a new filename. Download the new file and compare it. Do not rely only on the assistant saying “everything else is unchanged.”
Check editability after downloading
Open the PPTX in the application where you will present it. Try three separate checks:
- Select a title as a text object. On a disposable copy, change one word and save it. If the whole slide selects as a single image, the text is flattened.
- Select the chart and look for the application’s data-editing command. Verify the regional series remains 540, 490 and 70, with the correct labels. Editable labels alone do not make a chart data-editable.
- Reopen the saved copy and inspect all slides at presentation size. Look for clipped text, missing fonts, overflow, altered symbols and misplaced page references.
Our structural check found ppt/charts/chart1.xml and an embedded Excel sheet in both original decks. We also opened the Japanese PPTX in WPS and selected its title. These are different checks: package structure supports the native-object claim, while the desktop opening checks that this application can render the file. We have not tested every application or operating system.
Keep the source PDF and original output beside the final revision. A screenshot of a deck is useful visual evidence but cannot replace the editable file as the deliverable.
Troubleshoot the result that failed
| Problem | Practical next step |
|---|---|
| Only a chat outline, no file | Ask for an actual downloadable PPTX, then verify the download opens |
| Every slide is one image | Request text boxes and native chart objects; rebuild from verified data if needed |
| Wrong amount or missing qualifier | Cite the source page and exact correction; compare the revised file |
| Chart looks correct but cannot edit data | Check whether it is a picture, grouped shapes or a native chart; request the appropriate object type |
| Scan is misread | Verify OCR and tables first; do not hide uncertain numbers in a polished deck |
| Font substitution or overflow | Inspect in the destination app; use an available font and adjust layout on a copy |
| Page references are wrong | Rebuild the evidence ledger using the PDF’s actual page numbering |
| Translation changes the meaning | Recheck approval status, units and metric labels, not just grammar |
Once the sources, objects and final rendering pass, the deck is ready for an internal review. For a report assembled from web research, use the sourced research workflow first. For spreadsheet inputs that disagree, merge and quarantine Excel conflicts before turning totals into slides.
Start in Ofox Chat with the sample PDF. The goal is a presentation another person can edit and trace back to its evidence.