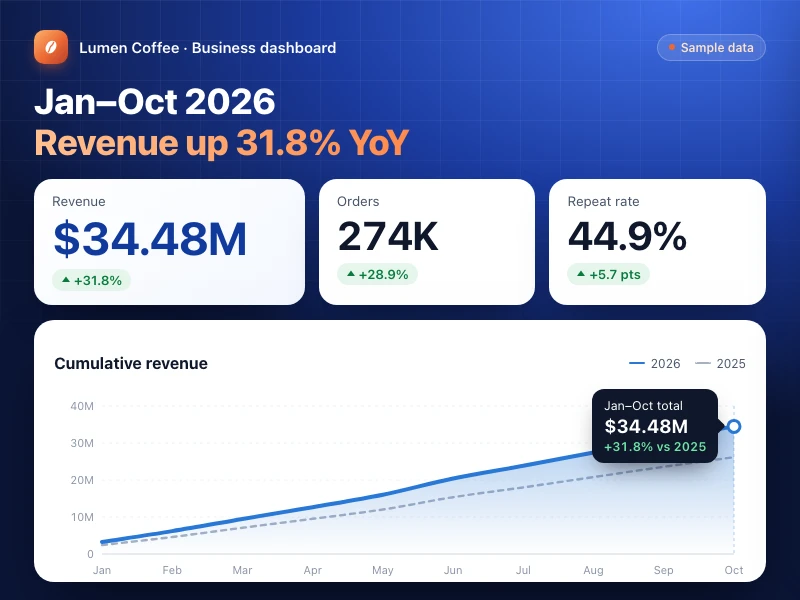
Data dashboard
Turn spreadsheet data into an interactive dashboard page: KPI cards, trends, breakdowns and a detail table, with filters and hover values.
Prompt
Build a business dashboard page from my 2026 online store sales data so our weekly meeting can see at a glance how things are going: KPI cards for revenue, orders, average order value and repeat rate at the top (with change vs the previous period and a sparkline), then a revenue trend chart compared with the previous period, category mix and channel performance, and a top-products table. Let me filter by date range, category and channel, show exact values when hovering over charts, and open a product's details on click. Mobile-friendly.
- Source
- Ofox
How to use
- 1
Tap “Make one like this”
Ofox Chat opens with this request already written. Sign in first if you haven’t.
- 2
Make it yours
Edit the highlighted parts of the prompt to swap in your own details.
- 3
Send and create
Send it and Ofox Chat writes and runs the code, then you can preview or download the result. Keep chatting to change it.
FAQ
What do I get?
A web page you can open right away. Ofox Chat writes the code and runs it in a sandbox; you can preview the result in the chat and download the code files.
Do I need to know how to code?
No. Describe what you want in plain words and upload any files it should work on — Ofox Chat writes and runs the code.
Can I edit the prompt?
Yes. The prompt goes into the Ofox Chat input box — swap in your own topic, add requirements or drop what you don’t need before sending.
Can I copy and use the prompt directly?
Yes. Tap “Copy” on the prompt card to get the plain text — it works in other AI coding tools too.
More like this
More Data prompts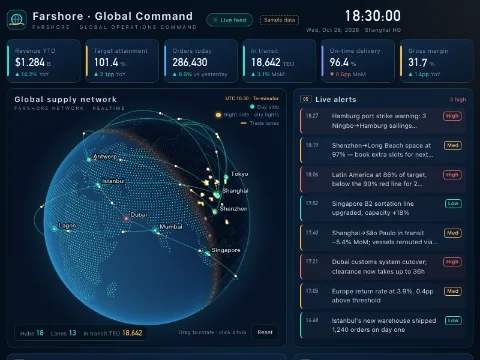 Global command centerCode · Data
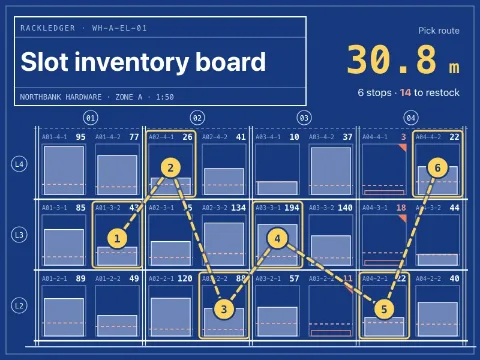 Slot inventory boardCode · Data
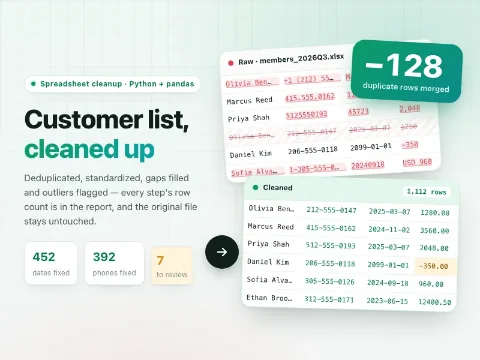 Clean up a spreadsheetCode · Data
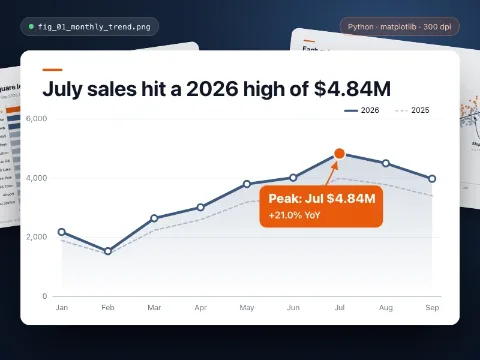 Data chartCode · Data
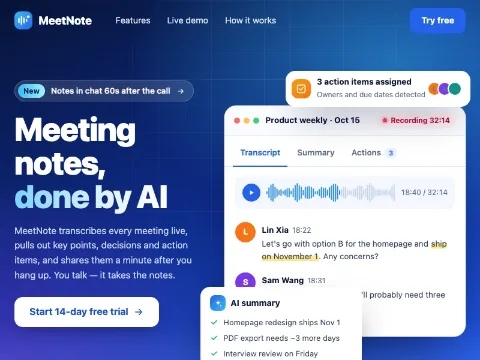 Product landing pageCode · Web pages
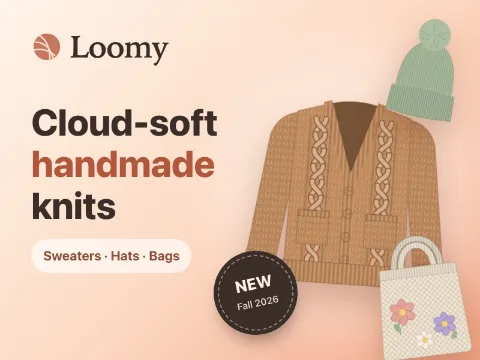 Fashion brand storeCode · Web pages
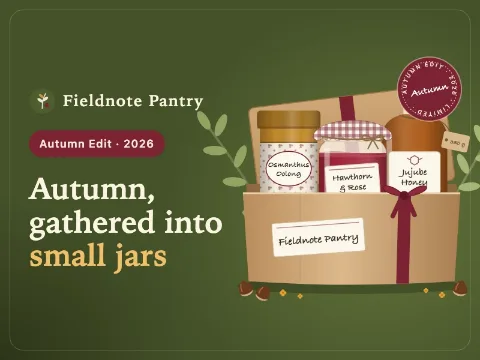 Food gift shopCode · Web pages
 Digital goods marketplaceCode · Web pages
 Subscription box siteCode · Web pages
 SaaS pricing & checkoutCode · Web pages
Have an idea of your own? Start creating
Describe the image you want in one sentence, and Ofox Chat creates it from scratch.