AI Chart Generator
Upload Excel or CSV data, say what you want to compare, and get a publication-ready chart with titles, axes, legend and highlights — exported as high-res PNG and SVG.
Example result
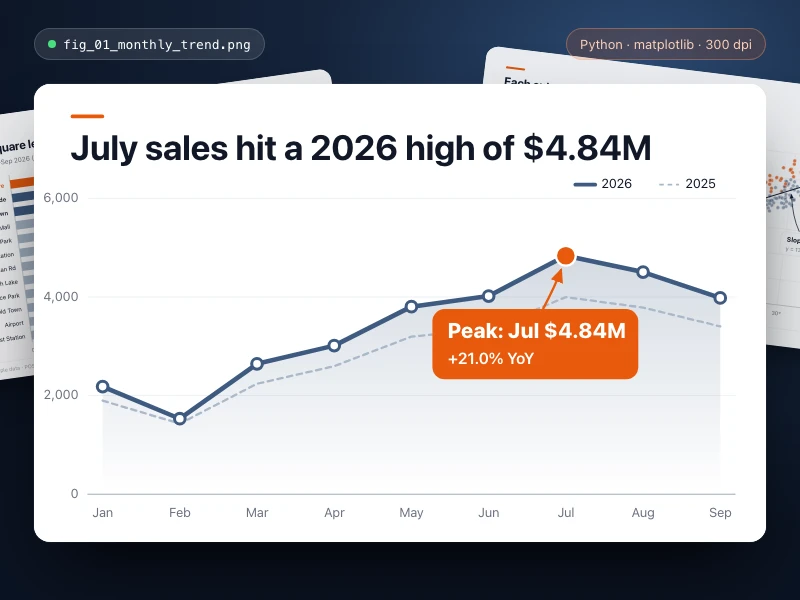
Data chart
Turn data into a publication-quality chart with Python: full titles, axes and legend, key points highlighted, exported as high-res PNG / SVG for your report.
- Source
- Ofox
Use cases
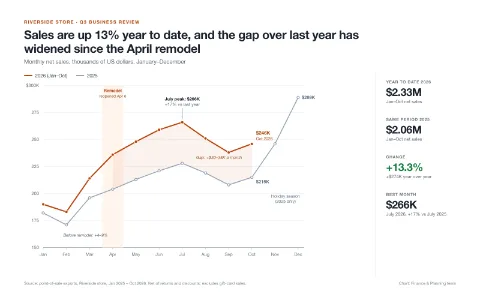
Charts for quarterly reports
Upload monthly store sales and get a line chart comparing this year with last, with the takeaway in the title, ready for your report.
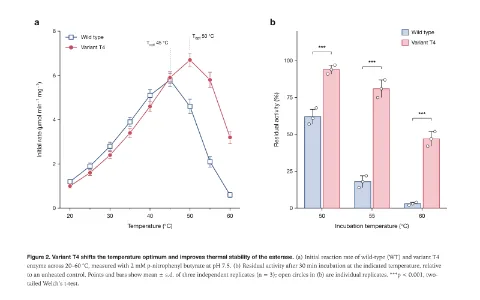
Papers and research
Plot experiment or survey data as publication-quality charts with axes, units and legends, and export SVG for your paper.
How it works
- 01
Fill in the blanks
Swap the highlighted parts for your own content, or keep the example.
- 02
Start
Hit the generate button and continue in Ofox Chat.
- 03
Keep refining
Not quite right? Say what to change and Ofox Chat keeps going.
FAQ
What does AI Chart Generator do?
Upload Excel or CSV data, say what you want to compare, and get a publication-ready chart with titles, axes, legend and highlights — exported as high-res PNG and SVG.
What do I need to prepare?
Nothing. Fill in the blanks above and start.
Can I edit the result?
Yes. Once it's ready, tell Ofox Chat what to change and it carries on.